There is never a shortage of economic data to study. The real trick may be to find the data that might be important to your portion of the automotive aftermarket and keep your eyes on that. Here are a couple of examples.
There is one problem in writing about economic data for a magazine. This article is being written in the last week of July – and all the data shown is the most up-to-date for that week. Economic data comes with a lag, which also impacts data freshness. So, by the time you are reading this in mid-to-late August, we may have some updated data.
E-Commerce
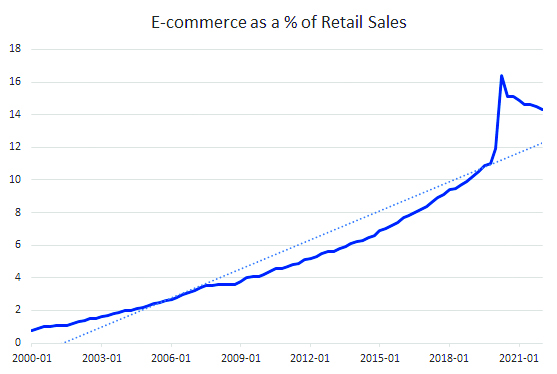
The U.S. Department of Commerce houses the U.S. Bureau of the Census. In addition to their primary job of counting how many people there are, they also track some other important economic indicators. One of those important indicators is retail sales. They look at retail sales in a number of ways, one of which is their quarterly estimate of e-commerce as a percentage of retail sales. As you can see from Chart 1, e-commerce sales were steadily rising for about two decades, growing from 0.8% in the first quarter of 2000 to 11% in the fourth quarter of 2019. Then, the Covid-19 lockdowns saw e-commerce zoom to 16.4% of retail sales in the second quarter of 2020. Since then, the percentage has fallen to where it is now 14.3% of sales. While it has dropped, it is still way above the long-term trend line, which is the dotted line in Chart 1.
While the second quarter of 2022 ended June 30, it generally takes at least six to seven weeks for the Census Bureau to finish their new estimate. The second quarter numbers are scheduled to be released on Aug. 19, so they may be available by the time you are reading this article. You can find them at census.gov/retail/index.html#ecommerce.
How does e-commerce impact the aftermarket? In the fleets of Class 1 through 3 delivery vehicles that we see fulfilling the last mile of delivery. The trend in Chart 1 may help predict how much maintenance, parts and tires are needed – as well as in future demand for EV delivery vehicles.
IRFs versus the Auto Dealers
We can combine data from a number of sources to get a handle on the breakdown between auto dealers and independent repair facilities in their fight for the auto repair dollar. One set of numbers comes from the AASA/ACA Joint Channel Forecast. In 2023, their forecast says the independents will have 71.1% of the market for auto care parts and service sales, while dealers will have 28.9%. That is the same ratio they have for 2022, and also what they project for 2024.
A second set of numbers comes from the NADA. In the 2021 NADA Data report, they report that dealers’ service sales were $54.6 billion while parts sales were $74.5 billion. They also estimate that the average dealership has 15 technicians, including their body shops.
If you are an IRF (independent repair facility) or aftermarket parts manufacturer/supplier, watching these numbers will help you understand the competition.
Gas Prices and Miles Driven
Vehicle Miles Traveled, or VMT, has become a closely watched economic indicator. As we move from a locked-down, working-from-home environment back toward something close to a pre-pandemic “normal,” VMT should rise back to its pre-pandemic levels. There are a couple of things to watch for when we study VMT. One of them is seasonality, and another is timeliness.
There are strong seasonal variations in VMT from month-to-month. For instance, VMT in March will typically be higher than VMT in February, both because of the length of the month and the fact that March is the start of “spring break” season, with more leisure travel.
One way to account for the seasonality is to compare the same months in different years. For instance, in February 2022 VMT was up 1.7% compared to February 2019. March 2022 was up 1.8% compared to March 2019. Those two months makes it seem like the drop in VMT has finally been reversed. Figure 2 shows not only the sharp increase from March 2020, the first lockdown month, it also shows the growth over the pre-pandemic years.
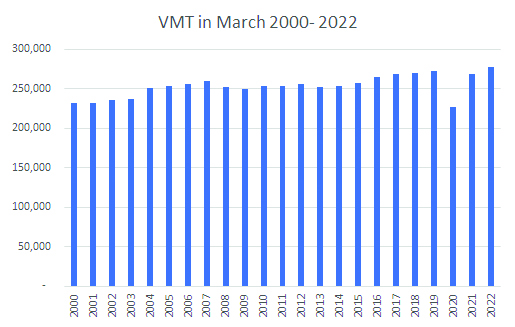
One way to account for the seasonality is to compare the same months in different years. For instance, in February 2022 VMT was up 1.7% compared to February 2019. March 2022 was up 1.8% compared to March 2019. Those two months makes it seem like the drop in VMT has finally been reversed. Chart 2 shows not only the sharp increase from March 2020, the first lockdown month, it also shows the growth over the pre-pandemic years.
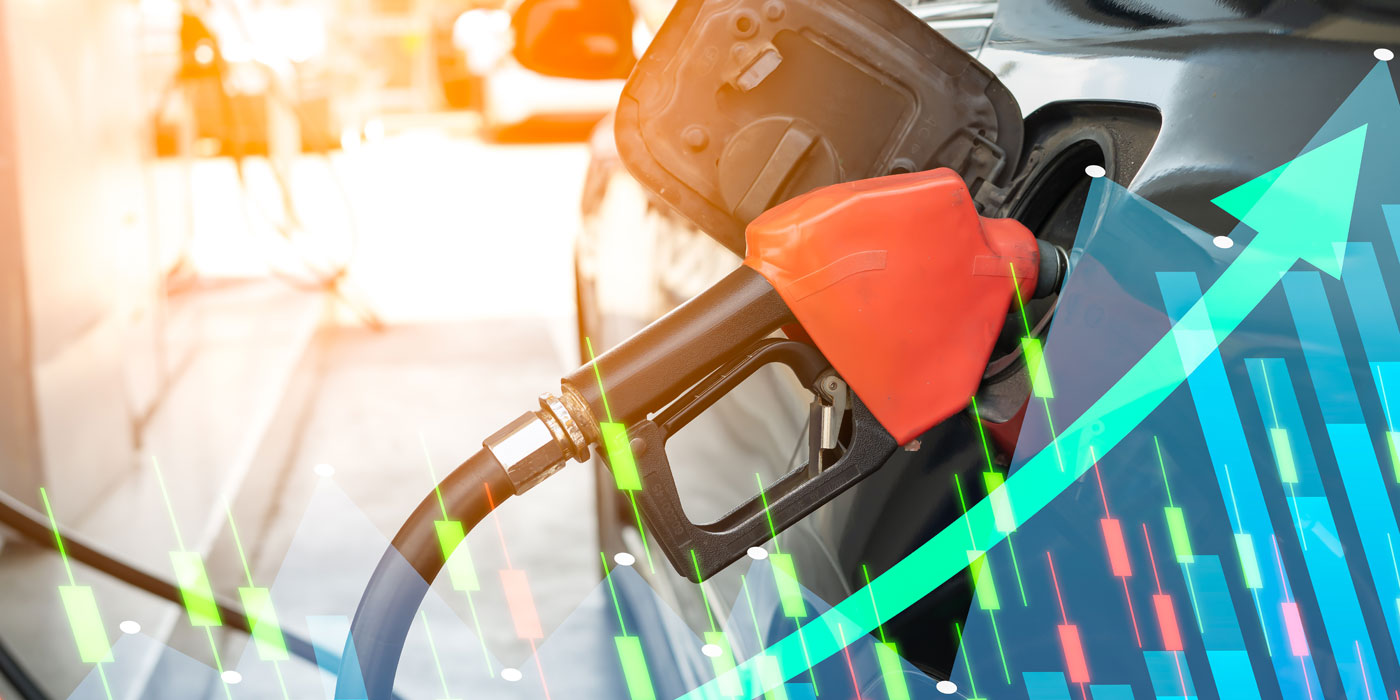
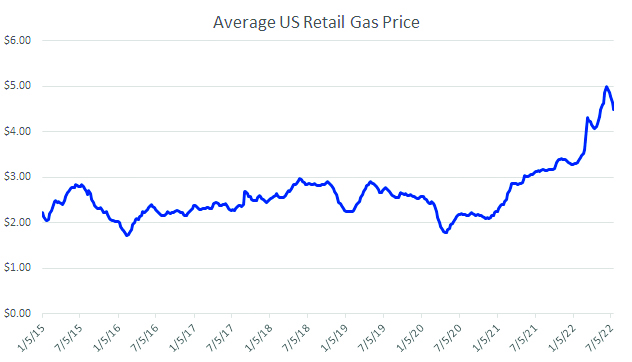
This recovery in VMT came to a halt in April, as VMT was down 3.8% compared to April 2019, while May was down 0.6% compared to 2019. What may be the primary reason for this reversal is of course shown in Chart 3, which is the U.S. average price of a gallon of gasoline. This chart measures the weekly average, as computed by the Energy Information Administration, part of the U.S. Department of Energy. It shows that the price of gasoline has been rising steadily since the beginning of 2021. The sharp run-up since the start of the Russian invasion of Ukraine seems to have cut down on a lot of discretionary driving, as we can see from the impact on VMT.
The government’s VMT reports come from the Office of Highway Policy Information at the U.S. Department of Transportation. You can find them at fhwa.dot.gov/policyinformation/travel_monitoring/tvt.cfm. The monthly reports typically come with a six- or seven-week lag. Thus, at the end of July our newest data comes from May. Gasoline price reports come from the Energy Information Administration (EIA) at the U.S. Department of Energy. Their reports are at eia.gov/dnav/pet/pet_pri_gnd_dcus_nus_m.htm. There is only a one-week lag on their reports. Since the number of miles traveled plays a definite role in scheduled maintenance by vehicle owners, and the price of gasoline affects VMT, these are both key variables for the aftermarket.
Diesel Prices
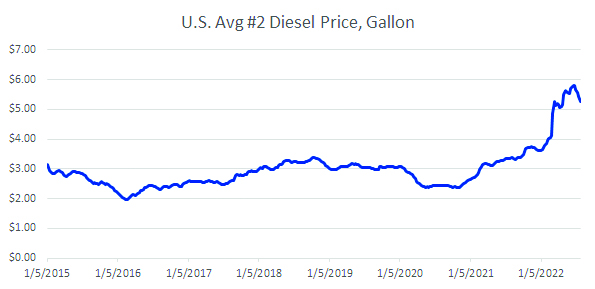
We took a look at gasoline prices on the previous page. The EIA also reports weekly on the price of diesel fuel. Chart 4 shows the price of a gallon of diesel fuel over the same time period as our gasoline chart. A lot more than trucking company executives need to be concerned about this price. Just about all goods we consume get delivered by ship, by train, or by truck and those are almost always powered by diesel fuel. While we seem to have dropped down from the peak, we are still up 58% from a year ago at this time. AMN