This “Data Did You Know” item comes from Babcox Media Audience Insights Manager Bruce Kratofil:
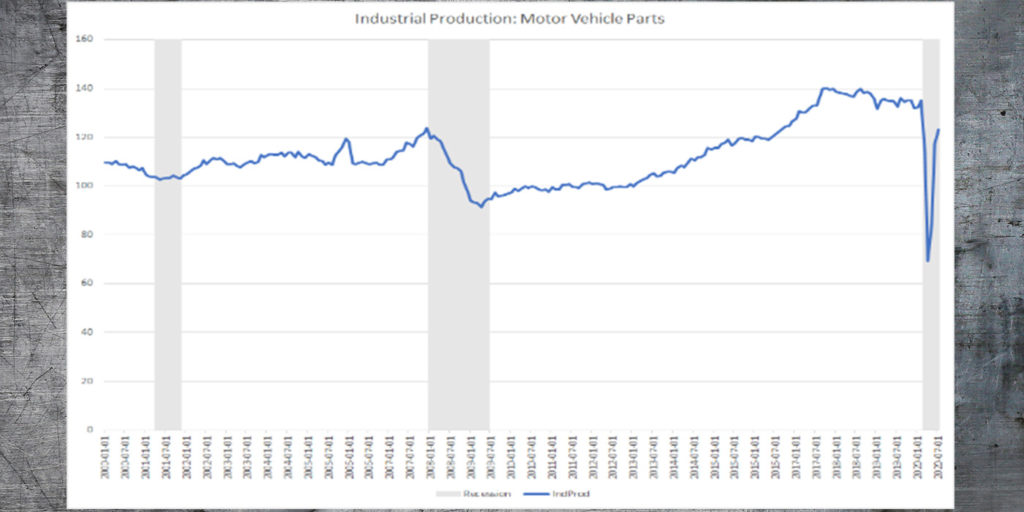
Nothing may illustrate the whiplash effect of the pandemic on the economy than this chart of Industrial Production of Auto Parts and Allied Goods. It measures the quantity produced compared to a base year, here where 2012=100. In the Great Recession of 2008 and 2009, the index dropped around 30 points over a period of a year and a half. This year, the index fell over 60 points in a two-month period (March and April). In the next three months, May through July, we’ve regained most of that drop. Note that this production of auto parts would include both OE parts and aftermarket parts.