In this installment of “The Pulse,” TLG Research looks at the economic trends influencing second quarter 2015 pricing changes for various parts and service categories. Here are TLG’s thoughts on the matter.
Price changes continue to fall all over the board. Overall, 2015 appears to be similar to 2014. With the year forecasted based on the first two quarters, we’ll end up with an increase of approximately 3.5 percent. Averaging a number of inflation forecasting sources, this year’s base CPI rate appears to be targeting approximately 2.5 percent to 3 percent.
The big question remains the economy. In the U.S., through June, U6 unemployment rates remained above 10 percent (a measure of those who are looking, given up or in marginal jobs), while it would seem the GDP moves downward each quarter. This makes for a fairly tepid 2015. Go global and it really is a tough picture. China and a lot of Asia remains flat, as do other continents. There isn’t much in this area that will help U.S. growth through exports.
It is understood we have been predicting greater inflation on raw materials than what has happened. Yet, it remains our conviction that manufacturers, installers and distributors should be carefully and strategically looking for price action opportunities assuming that once our U.S. debt and spending really catches up to us, we’ll be faced with a period of much higher inflation with lower economic growth. This combination is not ideal for instituting a price action.
METHODOLOGY:
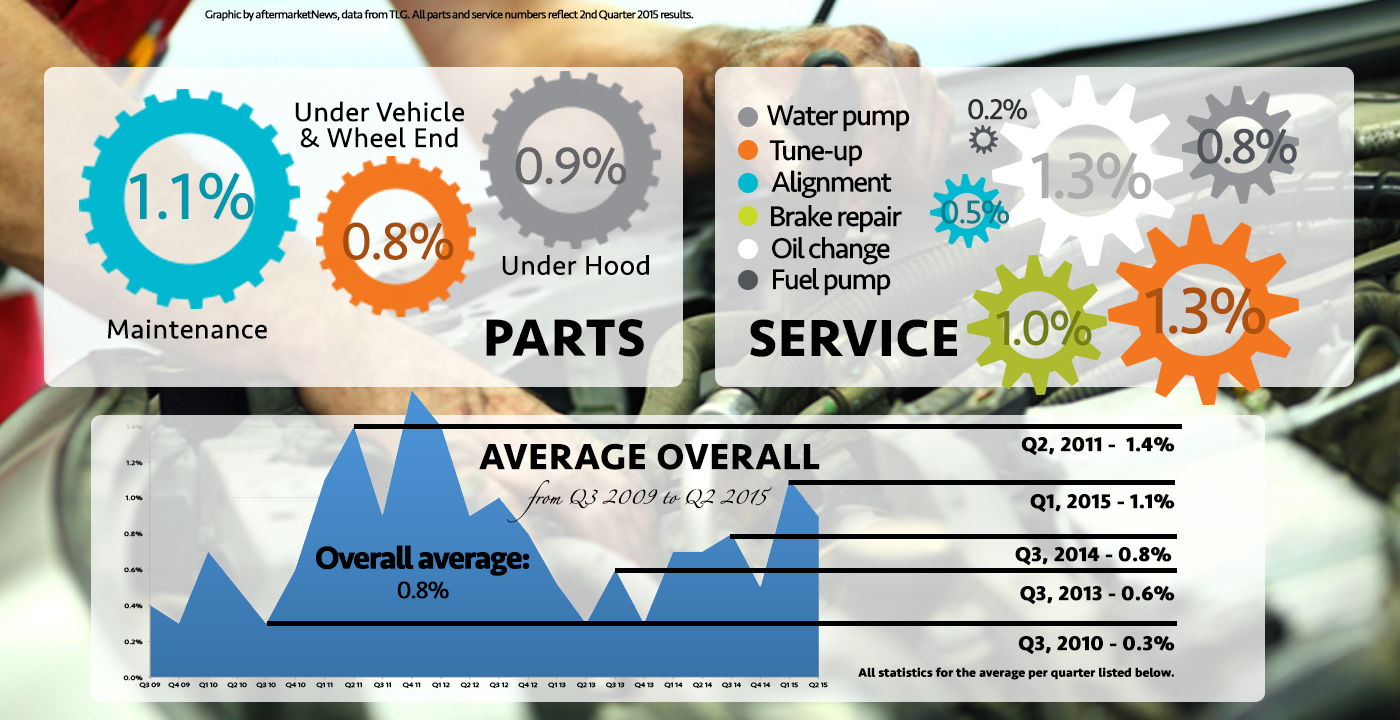
PARTS CATEGORY
- Based on reported pricing of parts to service repair centers
- Represents change of current quarter over the prior quarter
SERVICE CATEGORY
- Represents total job repair order price to prior quarter
NOTES TO PRICING CALCULATIONS:
The pricing is based on changes in the current quarter relative to the prior quarter. The data is collected from service repair centers with additional service repair center level pricing information provided by a number of sources. The “Parts Categories” includes only the parts. The “Service Categories” include both parts and labor and is based on the average reported. Pricing is collected in percent change, and is averaged across the U.S. Where needed the data is weighted in order to represent the entire market.
Definitions from BLS.gov:
- U-3: Total unemployed, as a percent of the civilian labor force (official unemployment rate)
- U-6: Total unemployed, plus all persons marginally attached to the labor force, plus total employed part time for economic reasons, as a percent of the civilian labor force plus all persons marginally attached to the labor force
© 2015 TLG Research Inc. All rights reserved.