We spend a lot of time studying the parts-ordering process by automotive technicians because it is a crucial component of the automotive aftermarket. This summer, Babcox Media conducted its biennial profile of independent repair facilities. Among the topics we cover in this survey are the questions like “Where do techs buy parts?” and “How do techs buy parts?” which we will look at here. Later this year, we will have the results of the 21st-annual Counterman P.A.R.T.S. (Professional Automotive Repair Technician) Survey, which will look at “What brands do they buy?” and “Why do they buy them?”
Where do they buy parts?
A key question that we ask in the IRF survey is “Please think about all the replacement parts you order in a given month. How much do you estimate you are getting from each of the following sources?” while constraining their answers so that they sum to 100%. The results are shown in Chart 1, with just under a half of their orders going to traditional program groups and slightly more than a quarter going to the retail chains.
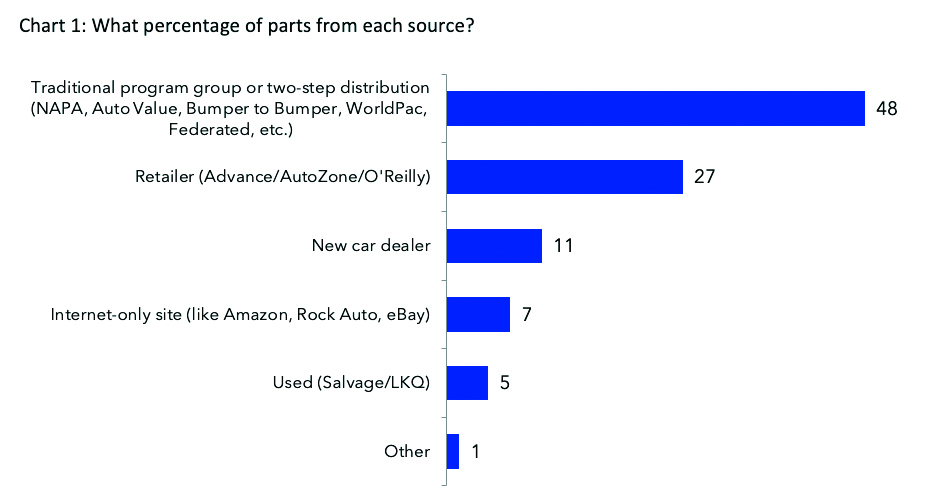
What’s remarkable about these results is how unchanging they are when we compare it to the last time we conducted this survey, in 2019. When comparing 2019 to 2021, the only category that had more than a 1% change was new-car dealers, which went from 13% in 2019 to only 11% this year. The dealers’ loss was split among the retailers and the internet-only sites, which each gained 1%. (These differences between 2019 and 2021 are all within the margin of error for these surveys.)
How do they buy parts?
Another thing we asked in this survey was how they ordered their parts. Chart 2 shows how this was done in 2021.
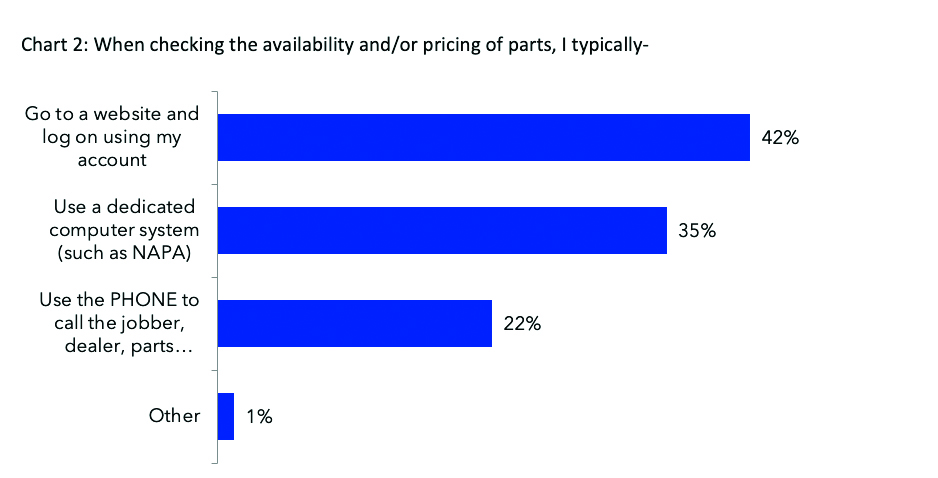
In the 2019 survey, the percentage who said they used the phone was 36% – so shops have been hanging up the phone and booting up the computer as phone use drops to 22%. The biggest growth was in the use of a dedicated computer system, which was only at 26% at the last survey, while the computer/website method gained 4% over this period.
Who specifies the brands?
We also compared how often the technicians would specify a particular brand of replacement part for a repair job, compared to how often their customers specify a brand. As Chart 3 shows, technicians are much more brand-specific than their customers.
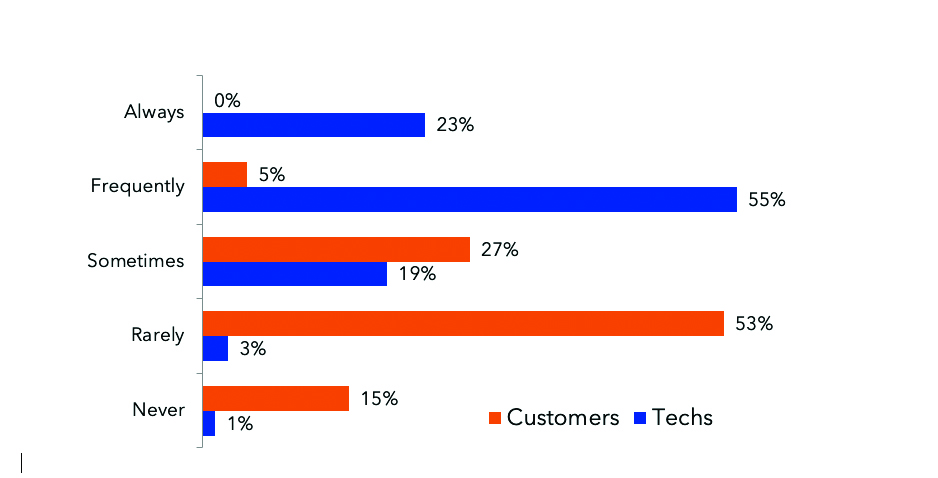
As Chart 3 shows, technicians “always” or “frequently” specify a brand 78% of the time, while customers do so only 5% of the time – and no one said that customers “always” specify the brand. On the other hand, half of our technician respondents say that more than two-thirds of their customers “rarely” or “never” specify a brand.