Vehicle servicing intervals are typically mileage-based, or mileage and time interval-based. So, when we have a large change in driving habits such as when the lockdown triggers a work-from-home trend, one of the many secondary effects may be a drop in demand for vehicle maintenance. In this article we will look at public and private sources of Vehicle Miles Traveled (VMT) estimates and look at the trends.
Where can you find VMT?
The main government source of VMT is the Office of Highway Policy Information at the Federal Highway Administration, which is part of the U.S. Department of Transportation. You can find their reports at www.fhwa.dot.gov/policyinformation/travel_monitoring/tvt.cfm. They compile information that mostly comes from “approximately 5,000 continuous traffic counting locations” compiled by the state. It generally takes six to seven weeks for a new monthly report. This means that January’s totals were released in the third week of March.
If you are a member of the Auto Care Association, you may be familiar with a private-sector source of data. In the ACA’s TrendLens (https://trendlens.autocare.org/), you can subscribe to VMT data from Arity, which collects VMT data through the tracking of more than 23 million mobile devices. Through Arity, you can get weekly reports as well as monthly, and with less of a time lag. Since Arity’s data is subscription-only, we will use the public data from the FHA here.
What has happened to VMT?
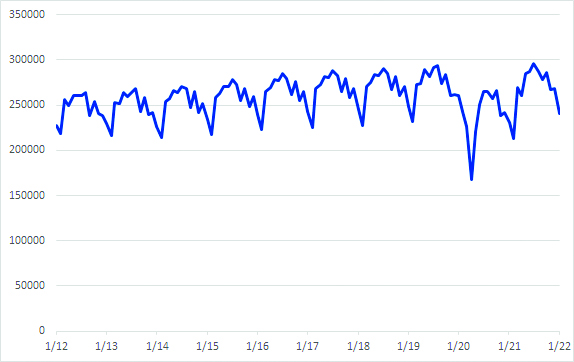
Ever since the initial lockdown of March-April 2020 was eased, VMT has been recovering. The only problem is that it is sometimes hard to tell by how much. Chart 1 shows VMT from January 2012 through January 2022, which at the time of this writing is the most recent data available. It’s hard to figure out what is going on in that chart because VMT has a lot of seasonal variations. We can see that one big dip, from the lockdown that started in March 2020, but there are lots of other peaks and valleys.
In fact, it is possible to see a pattern – notwithstanding the lockdown year, there are regular dips that always happen in February, a short month with bad weather and not a lot of leisure traveling. There are also regular highpoints that last during the summer months, when families hit the road for vacation travel. But all that seasonal movement, often referred to as “noise,” makes it hard to see the overall trend.
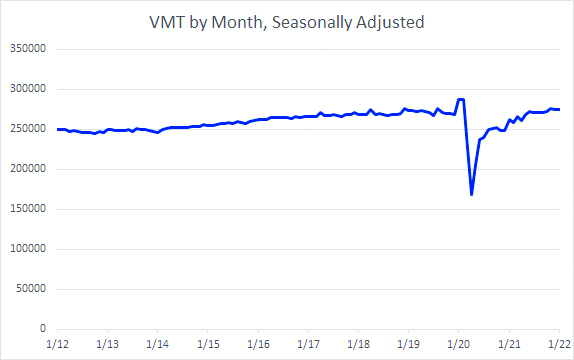
One way to ignore the seasonal noise is to do some seasonal adjustments to the data. When data is seasonally adjusted, you first try to estimate what those regular seasonal changes are. Once you have done that, you subtract those changes from the raw data to produce the “seasonally adjusted data.” The statisticians at the U.S. Department of Transportation have done that for us.
The seasonally adjusted data is in Chart 2. You still see the sharp plunge due to the lockdown, but otherwise you see the smooth, slow recovery in VMT, although not quite back to the pre-pandemic levels.
Doing the seasonal adjustments takes a certain amount of statistical training. There is another quick and dirty way to do it that is much easier. It is an “apples to apples” approach, only it may be more accurate to call it a “January to January” approach. Here, you would just compare the January numbers to all the previous Januarys, then in February you would look at the new monthly numbers and compare that to all the prior Februarys.
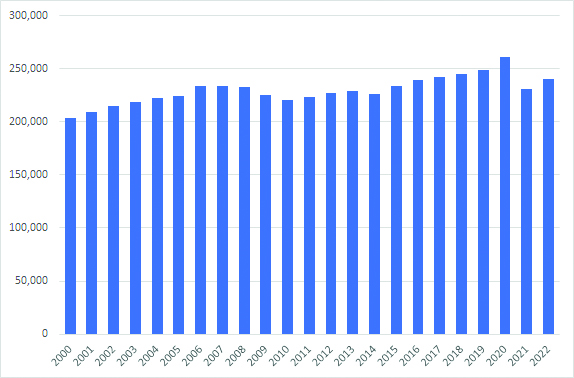
Chart 3 takes the most recent month’s data, January, and compares it to other Januarys going back to the year 2000. It shows that January 2022 was much stronger than January 2021, but is still much lower than the pre-pandemic month of January 2019 or 2020.
What else affects VMT?
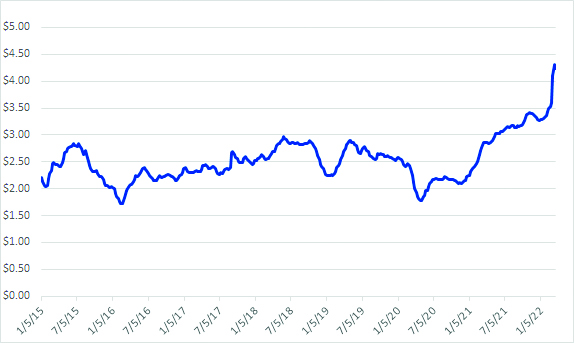
Changes in VMT are being influenced by more than just changes in “work from home” and other lockdown policies. Another factor that will affect vehicle miles driven is the price of gasoline. Chart 4 shows the weekly price of gasoline in the United States. Specifically, it is the U.S. All Grades All Formulations Retail Gasoline Prices, and it is calculated by the U.S. Energy Information Administration part of the U.S. Department of Energy. Because of the lead time in magazine production, this chart shows data through March 29. You can keep up to date by going to the EIA’s “this Week in Petroleum” newsletter at https://www.eia.gov/petroleum/weekly/.
Even though the big jump in price triggered by the Russian-Ukrainian war has gotten the most attention, gas prices have been going up since the beginning of 2021, at the same time that VMT has been rebounding, as you can see from Chart 4.
Are the laws of supply and demand not having an effect? In the short-run, large jumps in the price of gasoline have only small changes in driver behavior. Certain discretionary trips may get cancelled, but you will still be driving to work, the grocery store, and making other regular trips. If you were already planning to spend $2,000 on a spring break road trip to Florida, you are still going to do that even if gas is going to cost an extra $100 or $200. It is only in the long-run, when people are convinced that new gas price levels are permanent, that you will start to see big changes in behavior — like trading an SUV for a smaller car, moving closer to work, committing to public transit, etc.