O’Reilly Automotive Inc. has announced record revenue for its second quarter ended June 30, 2022.
Sales for the second quarter ended June 30, 2022, increased $205 million, or 6%, to $3.67 billion from $3.47 billion for the same period one year ago. Gross profit for the second quarter increased 3% to $1.88 billion (or 51.3% of sales) from $1.83 billion (or 52.7% of sales) for the same period one year ago. Operating income for the second quarter increased to $799 million (or 21.8% of sales) from $796 million (or 23.0% of sales) for the same period one year ago.
Net income for the second quarter ended June 30, 2022, decreased $9 million, or 1%, to $577 million (or 15.7% of sales) from $585 million (or 16.9% of sales) for the same period one year ago. Diluted earnings per common share for the second quarter increased 5% to $8.78 on 66 million shares versus $8.33 on 70 million shares for the same period one year ago.
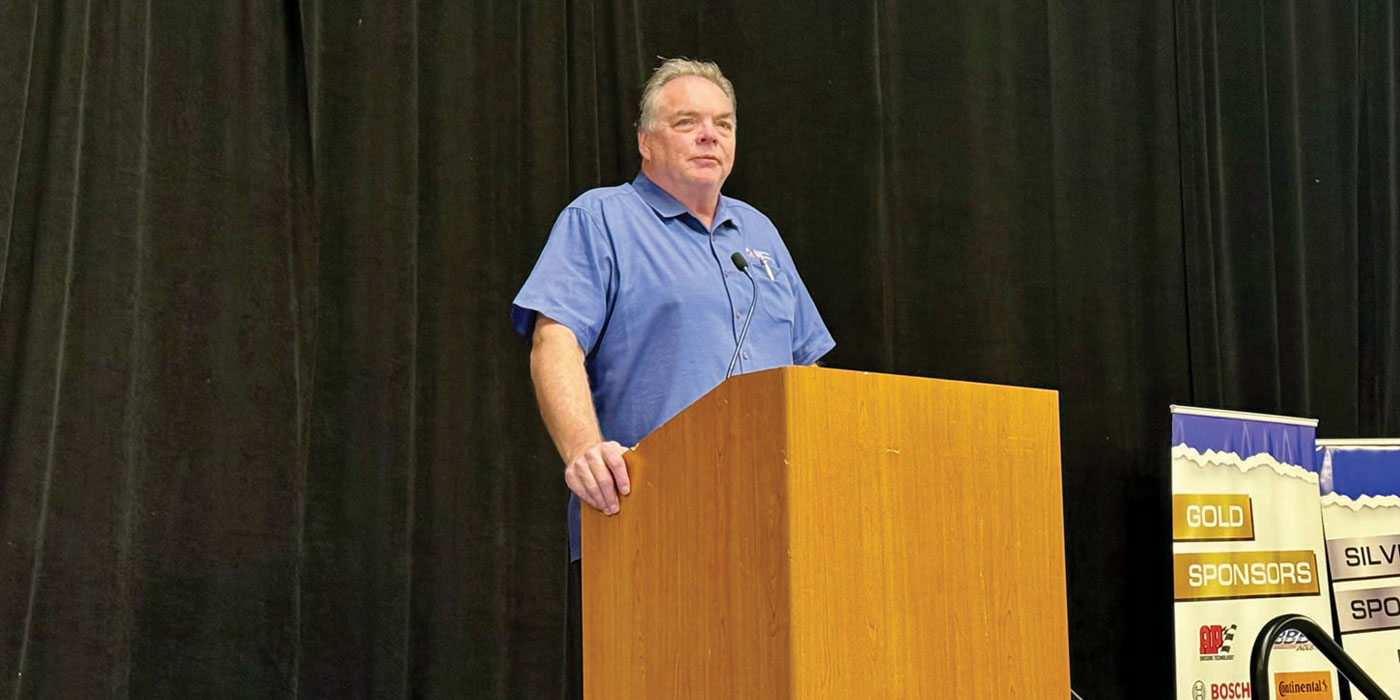
Greg Johnson, O’Reilly’s president and CEO, commented, “Our second quarter comparable store sales increase of 4.3%, and the corresponding three-year comparable store sales stack increase of 30.4%, are clear indicators of our team’s ability to grow our business and take market share. After experiencing volatility in our sales results in the first quarter, the trends in our business improved and were steady throughout the second quarter.”
Johnson continued, “We continue to be very pleased with the strong growth in our professional business, which performed in line with our expectations for the second quarter, while our DIY business faced more pronounced pressure from the impact of high fuel prices and continued significant broad-based inflation. Even facing these macroeconomic challenges, we are pleased with the strong sales volumes our team is generating in 2022, against comparisons to record comparable store sales results the past two years. We are extremely proud of Team O’Reilly’s ability to deliver continued growth on top of the strongest years in our company’s history, and I am grateful for the unrelenting focus each of our team members places on taking care of our customers.”
Year-to-Date Financial Results
Johnson concluded, “The pressure on our DIY customers from heightened inflation and fuel prices has impacted our year-to-date performance, and we have factored the current environment into our expectations for the second half of the year. As a result, we are reducing our full-year comparable store sales guidance to a range of 3% to 5%. Despite these pressures, we remain confident in the strength of the core underlying demand drivers of our business. We are pleased with our start to the third quarter in July and are extremely confident in our team’s ability to execute our business model and provide the excellent customer service that drives our success as we finish out 2022.”
Sales for the first six months of 2022 increased $410 million, or 6%, to $6.97 billion from $6.56 billion for the same period one year ago. Gross profit for the first six months of 2022 increased 4% to $3.59 billion (or 51.6% of sales) from $3.47 billion (or 52.9% of sales) for the same period one year ago. Operating income for the first six months of 2022 decreased 1% to $1.47 billion (or 21.1% of sales) from $1.49 billion (or 22.7% of sales) for the same period one year ago.
Net income for the first six months of 2022 decreased $28 million, or 3%, to $1.06 billion (or 15.2% of sales) from $1.09 billion (or 16.6% of sales) for the same period one year ago. Diluted earnings per common share for the first six months of 2022 increased 4% to $15.94 on 66 million shares versus $15.39 on 71 million shares for the same period one year ago.
2nd Quarter Comparable Store Sales Results
Comparable store sales are calculated based on the change in sales for U.S. stores open at least one year and exclude sales of specialty machinery, sales to independent parts stores and sales to team members. Online sales for ship-to-home orders and pick-up-in-store orders for U.S. stores open at least one year are included in the comparable store sales calculation.
Comparable store sales increased 4.3% for the second quarter ended June 30, 2022, on top of 9.9% for the same period one year ago. Comparable store sales increased 4.5% for the six months ended June 30, 2022, on top of 16.5% for the same period one year ago.
Share Repurchase Program
During the second quarter ended June 30, 2022, the company repurchased 2.2 million shares of its common stock, at an average price per share of $620.27, for a total investment of $1.38 billion. During the first six months of 2022, the company repurchased 3.4 million shares of its common stock, at an average price per share of $635.40, for a total investment of $2.15 billion. Subsequent to the end of the second quarter and through the date of this release, the company repurchased an additional 0.4 million shares of its common stock, at an average price per share of $654.37, for a total investment of $268 million. The company has repurchased a total of 89.4 million shares of its common stock under its share repurchase program since the inception of the program in January of 2011 and through the date of this release, at an average price of $214.47, for a total aggregate investment of $19.16 billion. As of the date of this release, the company had approximately $1.09 billion remaining under its current share repurchase authorization.
Updated Full-Year 2022 Guidance
The table below outlines the company’s updated guidance for selected full-year 2022 financial data:
| For the Year Ending | ||
| December 31, 2022 | ||
| Comparable store sales | 3% to 5% | |
| Total revenue | $14.0 billion to $14.3 billion | |
| Gross profit as a percentage of sales | 50.8% to 51.3% | |
| Operating income as a percentage of sales | 20.0% to 20.3% | |
| Effective income tax rate | 23.0% | |
| Diluted earnings per share (1) | $31.25 to $31.75 | |
| Net cash provided by operating activities | $2.1 billion to $2.5 billion | |
| Capital expenditures | $650 million to $750 million | |
| Free cash flow (2) | $1.3 billion to $1.6 billion |
(1) Weighted-average shares outstanding, assuming dilution, used in the denominator of this calculation, includes share repurchases made by the company through the date of this release.
(2) Free cash flow is a non-GAAP financial measure. The table below reconciles Free cash flow guidance to Net cash provided by operating activities guidance, the most directly comparable GAAP financial measure:
| For the Year Ending | |||||||||
| (in millions) | December 31, 2022 | ||||||||
| Net cash provided by operating activities | $ | 2,140 | to | $ | 2,560 | ||||
| Less: | Capital expenditures | 650 | to | 750 | |||||
| Excess tax benefit from share-based compensation payments | 10 | to | 20 | ||||||
| Investment in tax credit equity investments | 180 | to | 190 | ||||||
| Free cash flow | $ | 1,300 | to | $ | 1,600 |

