A lot of sales in the automotive aftermarket depend on the mileage we put on our vehicles. Parts and tire replacements and other service procedures are usually tied to mileage intervals, or mileage and time intervals. For years, vehicle miles traveled (VMT) showed a slow, stable rise. That steady rise was interrupted, first by the pandemic and lockdowns, and then just when things were getting back to normal, by skyrocketing fuel prices. Let’s take a look at the latest trends in fuel prices and vehicle miles traveled to see if things have stabilized.
Fuel Prices
While they have come down from their peak, gasoline prices have had an almost two-year run-up. Chart 1 shows weekly gas prices, although to smooth out some of the weekly fluctuations we are showing it as a four-week moving average. (Price data comes from the Energy Information Administration of the U.S. Department of Energy.) From 2016 through 2021, the price of gasoline almost always stayed within the $2 to $3 dollar a gallon range. Then, during the lockdown in April and May 2020 we saw a dip below $2 (Good news – Gas was less than $2 a gallon! Bad News – we had nowhere to go!). Then, from January 2021 to its peak in July 2022, you can see the steep increase in price.
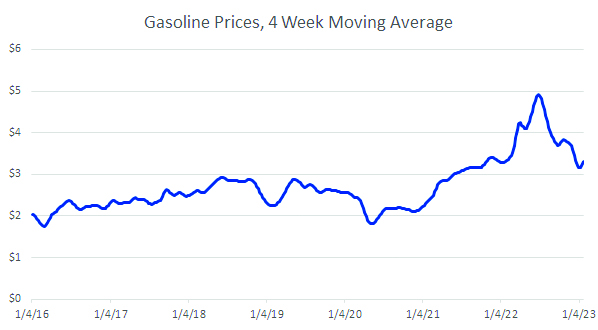
Another way to chart the impact of rising fuel prices is looking at their change from one year earlier. Since we are looking at weekly gas prices, the Chart 2 shows the change from 52 weeks ago. This chart highlights the alternating periods of rising and falling price trends we experienced up to the time of the pandemic. Then, the lockdown triggered almost a year of lower prices before the reversal that started in January 2021. Chart 2 also shows that we have reached the point where gas prices are now about the same as they were a year ago.
Miles Driven
With the cost of gasoline being an important cost in driving most vehicles, it would be natural to assume that high fuel costs would have a negative impact on vehicle miles traveled, or VMT. When you look at the data, there are some complications.

First, the data on miles driven is late, especially when you compare it with the weekly data available for prices. If you use the official government data from the Office of Highway Policy Information for the Federal Highway Administration, monthly data is released typically six to seven weeks after the end of the month. So, as this article is being written in late January, the most recent data available is from November. (If you are a member of the Auto Care Association, more recent data from the private sector is available via its TrendLens tool at https://trendlens.autocare.org.)
Second, the data is noisy. There is a considerable amount of seasonal fluctuations as you go from month to month. For instance, you will almost always have a spike in VMT in the summer months due to vacation travel. There will be a fall-off in the cold winter months, at least in the northern states, due to the weather. You will also see fluctuations when you compare a month with 28 days to months with 31 days. There are different ways to handle this seasonality. We can do seasonal adjustments, we can just compare like months (compare November 2022 only to other past Novembers), or we can do some kind of moving average. Here, maybe the simplest thing to do is compute the moving 12-month total every time you get a new month’s data. That is what we’ve done in Chart 3 on page 17– those numbers represent a year’s worth of VMT – for the most recent 12 months.

Third, the numbers are huge. VMT over the past 12 months is 3.2 trillion miles. If you write it out, that’s 3,200,000,000,000. To keep the number of zeros under control, Chart 3 is formatted to show billions of miles. There are also subtle ways to adjust Chart 3 to make it look more dramatic. As it is shown, you can see what is actually a fairly smooth time series for VMT that for the most part just slowly increases, until we get to the pandemic when VMT looks like it falls into a ditch.
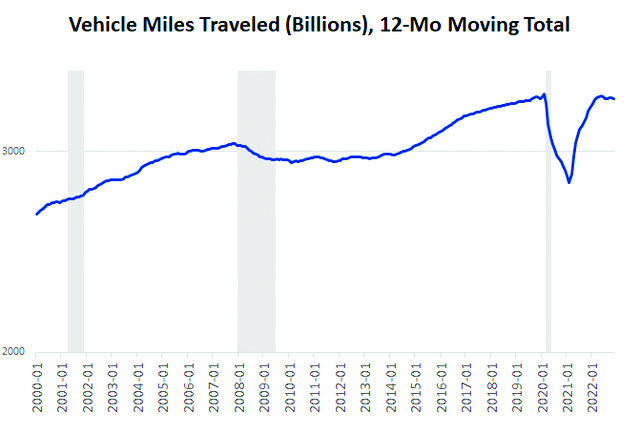
Do you want to make it look like VMT has fallen into the Grand Canyon instead of a ditch? Take Chart 3 and set the y-axis to run from 2,000 to 3,400. It is easy to do in Excel. That is what we have in Chart 4.
Charts 3 and 4 show the steep fall and rapid recovery of VMT after the 2020 lockdown. At the beginning of 2022, it looks like VMT had fully recovered. As the year went on, however, there were some down months. If you track the month-to-month changes in VMT, you will see that June, July and November 2022 were all negative, with the 12-month total of VMT falling from the previous month. June and July also were when the price of gas peaked. It’s not surprising that the large run-up in gas prices affected VMT, but it may be surprising that the effect was so small. We need the zoomed-in view of Chart 4 to really see any downturn. It is not really noticeable in Chart 3.
The reason is that in the short-run, demand for gasoline is not very responsive to changes in price. (Economists would say that it is price-inelastic.) As we pointed out in a column last April, in the short-run most reasons for driving are set and can’t be changed. You are still going to be driving to work and to the grocery store. Commercial driving will be unaffected. Only a small bit of discretionary driving will be affected. Only when gas prices are perceived to reach a new, permanent high will people start to change their behavior in a way that has a big impact on VMT. That could include switching to public transportation or moving somewhere that leaves them a shorter commute, (which will affect VMT), or switching to hybrids or electric vehicles (which won’t).
What does this mean for the aftermarket? Since 2022’s spike in gas prices had only a minimal effect on VMT, it will probably have only a small effect on the demand for aftermarket parts and services, which is good news for our industry. AMN