
BorgWarner Inc. recently reported third quarter results.
Third Quarter Highlights:
- U.S. GAAP net sales of $2,534 million, up 2% compared with third quarter 2019.
- Excluding the impact of foreign currencies and the net impact of acquisitions and divestitures, net sales were up 1% compared with third quarter 2019.
- U.S. GAAP net earnings of $0.53 per diluted share.
- Excluding the $(0.35) per diluted share related to non-comparable items (detailed in the table below), adj. net income was $0.88 per diluted share.
- U.S. GAAP operating income of $284 million, or 11.2% of net sales.
- Excluding the $33 million of pretax expenses related to non-comparable items, adj. operating income was $317 million. Excluding the impact of non-comparable items, adj. operating income was 12.5% of net sales.
- Net cash provided by operating activities of $481 million.
- Free cash flow was $390 million.
Financial Results:
The company believes the following table is useful in highlighting non-comparable items that impacted its U.S. GAAP net earnings per diluted share. The company defines adjusted earnings per diluted share as earnings per diluted share adjusted to eliminate the impact of restructuring expense, merger, acquisition and divestiture expense, other net expenses, discontinued operations, other gains and losses not reflective of the company’s ongoing operations, and related tax effects.
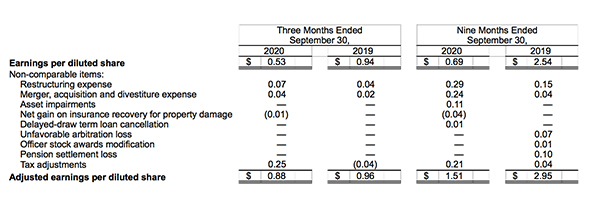
Net sales were $2,534 million for the third quarter 2020, up 2% from $2,492 million for the third quarter 2019, as increased demand for the company’s products offset lower industry production volume. Net earnings for the third quarter 2020 were $111 million, or $0.53 per diluted share, compared with net earnings of $194 million, or $0.94 per diluted share, for the third quarter 2019. Adj. net income per diluted share for the third quarter 2020 was $0.88, down from adj. net income per diluted share of $0.96 for the third quarter 2019. Adj. net income for the third quarter 2020 excluded net non-comparable items of $(0.35) per diluted share. Adj. net income for the third quarter 2019 excluded net non-comparable items of $(0.02) per diluted share. These items are listed in the table above, which is provided by the company for comparison with other results and the most directly comparable U.S. GAAP measures. The decrease in net earnings was primarily due to the increase in the company’s effective tax rate. The impact of foreign currencies increased net sales by approximately $22 million and had minimal impact on net earnings per diluted share for the third quarter 2020, compared with the third quarter 2019.
For the first nine months of 2020, net sales were $6,239 million, down 18% from $7,609 million for the first nine months of 2019, due primarily to production disruptions in the second quarter arising from the COVID-19 pandemic. Net income for the first nine months of 2020 was $142 million, or $0.69 per diluted share, compared with $526 million, or $2.54 per diluted share, for the first nine months of 2019. Adj. net income per share for the first nine months of 2020 was $1.51, down from $2.95 for the first nine months of 2019. Adj. net income for the first nine months of 2020 excluded net non-comparable items of $(0.82) per diluted share. Adj. net income for the first nine months of 2019 excluded net non-comparable items of $(0.41) per diluted share. These items are listed in the table above, which is provided by the company for comparison with other results and the most directly comparable U.S. GAAP measures. The decrease in net earnings was primarily due to the impact of lower revenue and the increase in the company’s effective tax rate. The impact of foreign currencies decreased net sales by approximately $66 million and decreased net earnings by approximately $0.02 per diluted share for the first nine months of 2020, compared with the first nine months of 2019.
Net cash provided by operating activities was $808 million for the first nine months of 2020, compared with $824 million for the nine months of 2019. Investments in capital expenditures, including tooling outlays, totaled $262 million for the first nine months of 2020 compared with $346 million for the first nine months of 2019. Compared with the end of 2019, balance sheet debt at the end of the third quarter 2020 increased $876 million, while cash and cash equivalents increased by $1,289 million.
Engine Segment Results: Engine segment net sales were $1,476 million during the third quarter 2020, compared with $1,514 million during the third quarter 2019. Excluding the impact of foreign currencies, net sales were down 4% from the prior year. Adj. earnings before interest, income taxes and non-controlling interest (“Adj. EBIT”) were $225 million during the third quarter 2020, compared to $241 million from the prior year. The decline in Adj. EBIT was primarily due to the impact of lower revenue. The impact of foreign currencies was not significant
Drivetrain Segment Results: Drivetrain segment net sales were $1,075 million during the third quarter 2020, compared with $993 million during the third quarter 2019. Excluding the impact of foreign currencies, net sales were up 8% from the prior year. Adj. EBIT was $131 million during the third quarter 2020, compared to $100 million from the prior year. The increase in Adj. EBIT was primarily due to the impact of higher revenue. Excluding the impact of foreign currencies, Adj. EBIT was $133 million, up $33 million from the third quarter 2019.
Fourth Quarter 2020 Guidance: For the fourth quarter 2020, net sales are expected to be in the range of $3.46 billion to $3.61 billion, under the assumption that there are not additional production disruptions arising from COVID-19. This includes the impact of the acquisition of Delphi Technologies, which is expected to increase fourth quarter sales by $950 million to $1.0 billion. Excluding the impact of non-comparable items, adj. operating margin is expected to be in the range of 8.8% to 9.6%.
Full Year 2020 Guidance: For the full-year 2020, net sales are expected to be in the range of $9.7 billion to $9.85 billion, under the assumption that there are not additional production disruptions arising from COVID-19. This implies a year-over-year decrease in organic sales of 12.5% to 13.5%. The company expects its blended light-vehicle market to decline in the range of approximately 18.5% to 19.0% in 2020. The divestiture of the thermostat product line decreased year-over-year sales by approximately $30 million. Foreign currencies are expected to result in a year-over-year decrease in sales of approximately $18 million.
Excluding the impact of non-comparable items, adj. operating margin is expected to be in the range of 8.7% to 9.0%. Full-year operating cash flow is expected to be in the range of $900 million to $975 million, while free cash flow is expected to be in the range of $475 million to $525 million. The company’s free cash flow guidance includes approximately $100 million negative impact from transaction-related costs and synergy-related costs associated with the Delphi Technologies acquisition.